-


Follow Us

A lot has been made about the Braves’ lack of clutch factor due to the loss in Philadelphia, so let’s dig into those individual stats.
All of these stats are from Baseball Reference.
Before we dig into each individual’s stats, there are a few definitions we have to familiarize ourselves with.
Late & Close are Plate Appearances in the 7th or later with the batting team tied, ahead by one, or the tying run at least on deck.
tOPS+ – OPS+ of this split relative to the player’s overall OPS
sOPS+ – OPS+ of this split relative to the major league OPS for this split
So let’s begin:
Austin Riley Clutch Stats
- Totals (235 PAs): .272/.328/.424, 17 extra-base hits, 28 RBIs, 109 OPS+
- RISP (57 PAs): .309/.333/.455, 4 XBH, 19 RBIs, 109 tOPS+, 117 sOPS+
- 2 outs, RISP (29 PAs): .286/.310/.286, 0 XBH, 8 RBIs, 62 tOPS+, 74 sOPS+
- Late & Close (39 PAs): .211/.231/.342, 3 XBH, 3 RBIs, 51 tOPS+, 64 sOPS+
- High Lvrge (49 PAs): .234/.265/.340, 3 XBH, 7 RBIs, 61 tOPS+, 75 sOPS+
So what are we looking at, exactly? Well, for starters, Austin Riley’s OPS is 9% above league average, which is down from his career average, but he’s actually been better with runners in scoring position, 17% better than the rest of the league in the same position, but that’s where the good news ends.
In every other clutch split that I thought was notable, two outs & RISP/ Late & Close/ High Lvrge, Autin Riley is much worse. He’s anywhere from 40-50% worse compared to his own OPS and 25-35% worse compared to the league average OPS in the same situation. That’s not ideal for the largest contract in Braves history.
So, the notion that Austin Riley is not clutch is true, which isn’t exactly breaking news for Braves fans.
Matt Olson Clutch Stats
- Totals (230 PAs): .234/.335/.462, 21 extra-base hits, 29 RBIs, 121 OPS+
- RISP (61 PAs): .200/.311/.260, 3 XBH, 14 RBIs, 49 tOPS+, 61 sOPS+
- 2 outs, RISP (30 PAs): .130/.333/.174, 1 XBH, 3 RBIs, 37 tOPS+, 51 sOPS+
- Late & Close (42 PAs): .176/.333/.324, 3 XBH, 3 RBIs, 70 tOPS+, 91 sOPS+
- High Lvrge (59 PAs): .220/.322/.340, 4 XBH, 11 RBIs, 70 tOPS+, 93 sOPS+
Once again, Matt Olson’s OPS is 21% above league average, and he’s much worse with runners in scoring position, and even worse with runners in scoring position with two outs, about 40% and 50% worse compared to the league average.
However, when the game is Late & Close and in high-leverage situations, see the definition at the beginning of the article, he’s much better than his normal production, with less than 10% drop-off. While Matt Olson is awful with runners in scoring position, he’s been more reliable later in games that are close, but that’s still not good enough, honestly.
Simply put, the Braves’ two highest-paid players are putting up hollow stats and aren’t coming through when it matters most.
Ozzie Albies Clutch Stats
- Totals (228 PAs): .240/.303/.351, 13 extra-base hits, 19 RBIs, 83 OPS+
- RISP (60 PAs): .288/.367/.346, 3 XBH, 12 RBIs, 120 tOPS+, 100 sOPS+
- 2 outs, RISP (27 PAs): .120/.185/.120, 0 XBH, 3 RBIs, -5 tOPS+, -10 sOPS+
- Late & Close (42 PAs): .229/.357/.314, 1 XBH, 3 RBIs, 96 tOPS+, 96 sOPS+
- High Lvrge (63 PAs): .204/.302/.222, 1 XBH, 7 RBIs, 63 tOPS+, 55 sOPS+
Good lord, almighty. Ozzie Albies is all over the place. He’s already 17% below league average as a hitter, in terms of OPS, but he’s 20% better with runners in scoring position, or about league average with RISP.
Then, with two outs and RISP, he’s 110% worse than league average. That almost seems impossible because in Late & Close situations, he’s nearly league average, but then 45% below league average in high leverage situations.
Marcell Ozuna Clutch Stats
- Totals (219 PAs): .279/.425/.471, 15 extra-base hits, 24 RBIs, 152 OPS+
- RISP (59 PAs): .244/.390/.378, 4 XBH, 15 RBIs, 72 tOPS+, 115 sOPS+
- 2 outs, RISP (29 PAs): .227/.414/.318, 2 XBH, 7 RBIs, 65 tOPS+, 116 sOPS+
- Late & Close (39 PAs): .276/.462/.414, 2 XBH, 5 RBIs, 97 tOPS+, 155 sOPS+
- High Lvrge (43 PAs): .290/.465/.452, 3 XBH, 11 RBIs, 105 tOPS+, 169 sOPS+
Well, well, well. If it isn’t the Big Bear. He’s 52% above average for his overall OPS, and compared to league average, he’s above average in every clutch statistic. He’s 15% above league average with RISP, 16% with two outs and RISP, a whopping 55% in Late & Close situations, and an eye-popping 69% above league average in high leverage situations.
As of right now, Marcell Ozuna is the Braves offense’s best hitter in basically any situation, and it’s not particularly close, which is wild because it seems like the Big Bear puts up a bunch of hollow stats, but in reality, it’s Matt Olson and Austin Riley that are doing that.
Michael Harris II Clutch Stats
- Totals (218 PAs): .223/.255/.332, 14 extra-base hits, 31 RBIs, 63 OPS+
- RISP (58 PAs): .265/.286/.469, 7 XBH, 28 RBIs, 153 tOPS+, 106 sOPS+
- 2 outs, RISP (29 PAs): .211/.286/.316, 2 XBH, 7 RBIs, 107 tOPS+, 75 sOPS+
- Late & Close (43 PAs): .229/.293/.371, 3 XBH, 11 RBIs, 127 tOPS+, 91 sOPS+
- High Lvrge (55 PAs): .271/.296/.521, 7 XBH, 25 RBIs, 173 tOPS+, 133 sOPS+
Michael Harris II is an anomaly. He’s been absolutely abysmal this season at the plate. His average has fallen off a cliff, resulting in an OPS that is 37% below league average, but Harris apparently has a flair for the dramatics.
In every clutch stat I looked at, Money Mike is more productive than his average. He’s 53% better with RISP, 7% with two outs and RISP, 27% better in Late & Close situations, and 73% better in High Leverage situations.
Now, he’s only better than league average in two of those scenarios — RISP and High Leverage. But still, overall, Harris is better when the lights are brightest.
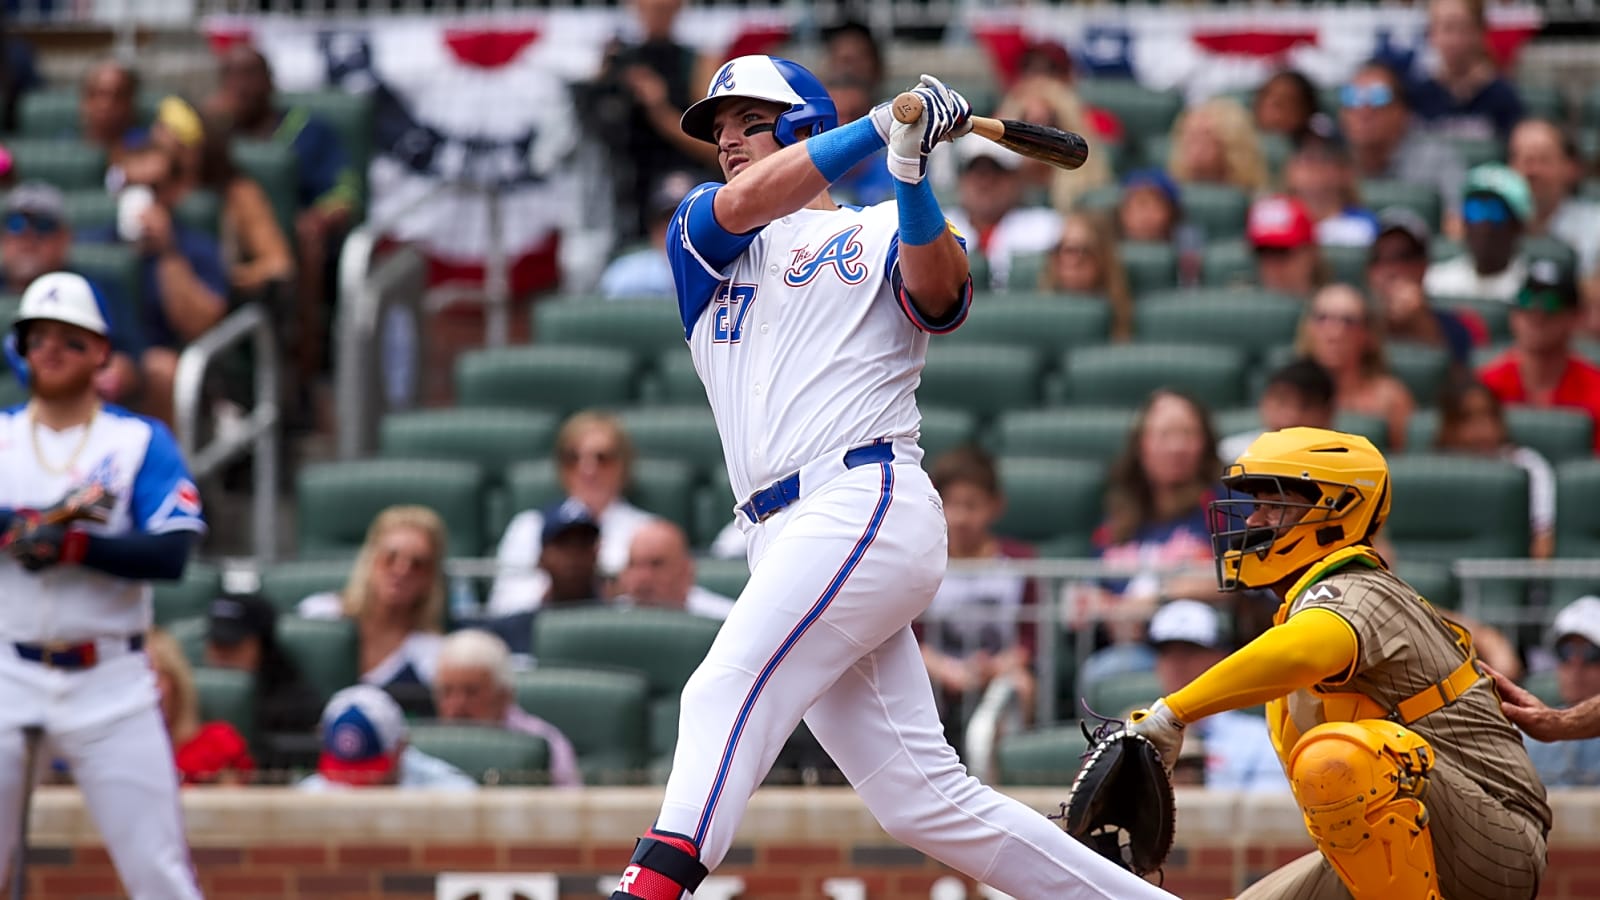
Sean Murphy Clutch Stats
- Totals (127 PAs): .216/.315/.468, 12 extra-base hits, 18 RBIs, 117 OPS+
- RISP (29 PAs): .259/.310/.519, 3 XBH, 11 RBIs, 109 tOPS+, 126 sOPS+
- 2 outs, RISP (18 PAs): .294/.333/.706, 3 XBH, 10 RBIs, 157 tOPS+, 196 sOPS+
- Late & Close (29 PAs): .292/.414/.708, 4 XBH, 8 RBIs, 183 tOPS+, 219 sOPS+
- High Lvrge (37 PAs): .226/.351/.355, 2 XBH, 7 RBIs, 87 tOPS+, 106 sOPS+
Drake Baldwin Clutch Stats
- Totals (105 PAs): .337/.381/.531, 9 extra-base hits, 15 RBIs, 153 OPS+
- RISP (28 PAs): .259/.286/.370, 1 XBH, 9 RBIs, 45 tOPS+, 81 sOPS+
- 2 outs, RISP (13 PAs): .333/.385/.583, 1 XBH, 5 RBIs, 111 tOPS+, 179 sOPS+
- Late & Close (29 PAs): .250/.250/.250, 0 XBH, 5 RBIs, 13 tOPS+, 45 sOPS+
- High Lvrge (23 PAs): .348/.348/.478, 1 XBH, 6 RBIs, 81 tOPS+, 138 sOPS+
Since Sean Murphy and Drake Baldwin have been splitting starts, their sample size is much smaller and should be taken with a grain of salt. However, I do think that it’s interesting that most Braves fans would assume, including this one, that Baldwin is much better in clutch situations, but it’s actually Murphy.
The veteran is 26% better than league average with RISP, compared to the rookie being 19% worse. Murphy is 96% better with two outs and RISP, compared to Baldwin being 79% better. Murphy is also 119% better than league average in Late & Close situations, compared to Baldwin being 55% worse.
Both catchers, however, have been among the Braves best contributors, no matter the situation.
The Braves’ best players, who they are paying the most, aren’t coming through in the clutch. Matt Olson has been better than Austin Riley, but both are underperforming relative to their capabilities and salaries. On the other hand, guys like Marcell Ozuna and Sean Murphy are stepping up when it matters most, while Michael Harris II is overperforming compared to his season averages.
More must-reads:
- Orioles' Pete Alonso reflects on controversial Mets exit
- Baseball icon Ken Griffey Jr. to return to WBC in prominent role
- The 'Receiving leaders by NFL season' quiz
Breaking News
Trending News


Customize Your Newsletter
 +
+
Get the latest news and rumors, customized to your favorite sports and teams. Emailed daily. Always free!

PRIVACY POLICY COOKIE POLICY CONTACT US
ABOUT YARDBARKER TERMS OF SERVICE
By using this site, you agree to our Terms of Service and Privacy Policy.
This site is for entertainment purposes only.
There is no gambling offered on this site.
Gambling Problem? Call 1-800-Gambler.