-

-


Follow Us
-


The Arizona Diamondbacks are having somewhat of a roller-coaster of a season so far. Thanks to winning nine of their last 12 games, including the current five game winning streak, they've run their record back up three games above .500 with a 26-23 record.
The pitching staff, especially the rotation, along with the offense, have taken turns running hot and cold. Recently both have been firing, leading to the recent hot streak. Of course weaker opponents such as the Giants and Rockies are a factor, and in fact we identified this opportunity over 10 days ago.
Still, looking at the rotation in particular, it's pretty easy to see where the turnaround took place, and it actually started before the schedule softened.
Tracking the Ups and Downs of the Diamondbacks Rotation
At the end of play on May 3, following a sweep at the hands of the Chicago Cubs, the D-backs had an MLB worst 5.42 rotation ERA. The underlying, predictive metrics such as Statcast xERA (5.79) or FIP (4.83) gave little solace or hope that the poor results were due to bad luck.
But since May 5 in 16 starts the D-backs' rotation ERA is 2.48, the second-best in MLB. The expected metrics don't quite match those results, but are much-improved as well. Their xERA has been 4.15, while their FIP has been 3.71 and xFIP 3.89.
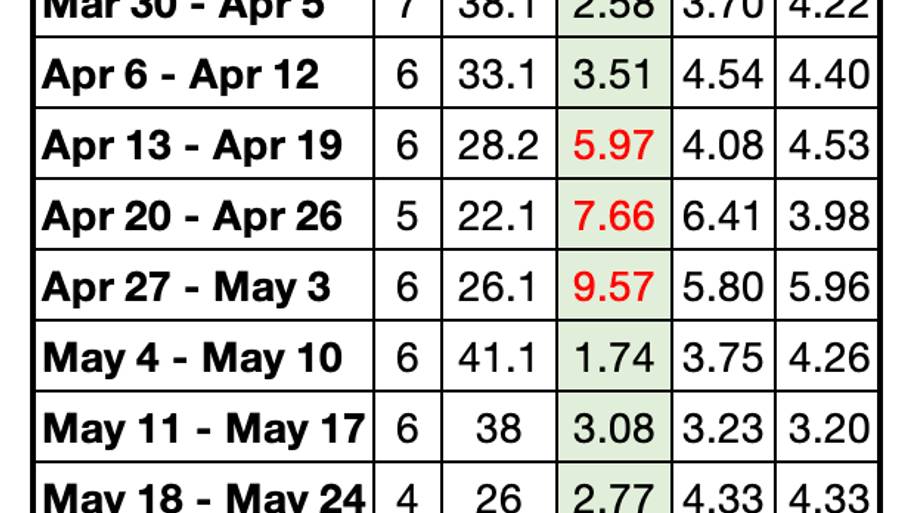
Another way to view this is the week by week ERA alongside FIP and xFIP. The sum of each week shown in the table below is a 4.28 ERA, which is now 19th in MLB. It's clearly much improved from where they were through May 3, but there is still a ways to go to climb into the top half of the league.
A key personnel change occurred in mid-April when Merrill Kelly returned on April 14, while Brandon Pfaadt was moved to the bullpen following his last start on April 11. Kelly struggled mightily his first four starts, but has been outstanding over his last three.
Eduardo Rodriguez and Michael Soroka have gotten excellent results, barring one hiccup for Soroka. Ryne Nelson has been steady in May after a very rough spate of starts in April.
Zac Gallen has been up and down, and is the last remaining starter to get headed in the right direction, although his most recent start was encouraging.
Pitcher ERA vs Expected ERA
Before we get into projections, we first want to look at the individual pitchers and check their ERA results against the expected metrics. The "Avg X" column in the table below is the average of xERA, FIP, xFIP, and SIERA, each of which is more predictive of future ERA than ERA itself. That helps us gain a little more perspective on their seasons to date.
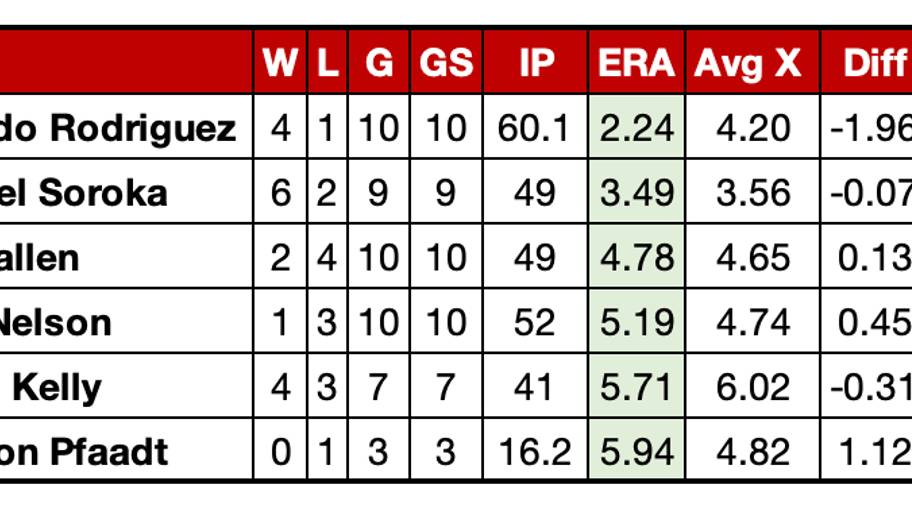
Rodriguez has been outstanding, pitching seven innings or more four times, and continuing to limit runs. The underlying metrics suggest some regression to the mean however, as the Avg X is nearly two runs higher. That stands to reason, as I don't think anyone expects him to have an ERA well below 3.00 by the end of the season.
Soroka's good results so far, and conversely Gallen's spotty results, are both supported by the expected stats, which think they've both gotten almost exactly what they've deserved.
Nelson has pitched a little better year to date than his ERA suggests, and he has clearly been trending in a good direction in May. Kelly is difficult to assess due to the extreme poor nature of his first several starts off the injured list. He's given up just one run in his last 15-plus innings however, and appears to have righted his ship.
Projections for the Rest of 2026
We are just not very good at projecting pitcher performance. Pitchers can make the quickest changes for the good with seemingly minor mechanics tweaks, changing a grip or arm angle, and of course adding a pitch.
On the flipside, when they fall out of sync but there is no obvious injury present, it's difficult to pinpoint why they're struggling. And of course the specter of pitcher injury looms large at all times. Even minor soreness or injury to an elbow or shoulder can turn a good pitcher into a run machine for the opposition.
Looking at FanGraphs' Depth Chart Projections for the rest of the season provides at least some guidelines for what to expect. These projections take into account the most recent performance, as well as the past several seasons.
The projections are weighted, so most recent performance counts most, but small sample sizes of 10 starts in current season don't move the projection needle as much as many might expect.
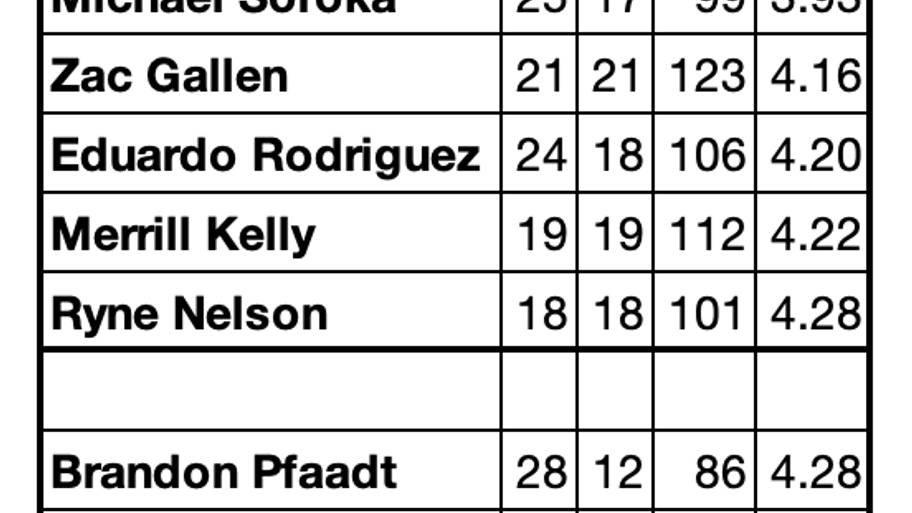
That's why Gallen (4.16) comes in with the second best ERA projection behind Soroka (3.93). His excellent performance prior to 2024 still weighs into these calculations, but admittedly, recency bias causes even this writer to suggest taking the over.
Rodriguez, not-so-coincidentally, has a projection that matches his expected stats, with Kelly and Nelson slotted right in behind.
Note that Brandon Pfaadt is included in the table above just in case he finds his way back into the rotation, although that possibility is beginning to look more and more remote.
And last but not least, the projections include five starts for Corbin Burnes. In fact he is targeting an All-Star Break return, and if there are no setbacks could easily get in a dozen starts in 2026.
Just how effective he'll be coming off injury and trying to get ramped up and stretched out remains to be seen. Expectations should be tempered.
For an even deeper dive into these pitchers check out the Snakes Territory Podcast, where I discussed these topics along with Jesse Friedman and renowned pitching analyst Eno Sarris of The Athletic.
Summary
MLB league average ERA is 4.13, so the projections indicate the D-backs should fall in somewhere around there, maybe a touch higher. They currently rank 19th so coming in at 15th seems like a reasonable expectation if everyone is healthy.
But as we see from the week-to-week fluctuations at the top of this article, it's just very difficult to predict where things will shake out in the end.
More must-reads:
- What Red Sox could do after SS Trevor Story's latest injury
- Gerrit Cole delivers six strong innings in 2026 debut for Yankees
- The 'ERA leaders since 2003' quiz
Breaking News
Trending News


Customize Your Newsletter
 +
+
Get the latest news and rumors, customized to your favorite sports and teams. Emailed daily. Always free!

PRIVACY POLICY COOKIE POLICY CONTACT US
ABOUT YARDBARKER TERMS OF SERVICE
By using this site, you agree to our Terms of Service and Privacy Policy.
This site is for entertainment purposes only.
There is no gambling offered on this site.
Gambling Problem? Call 1-800-Gambler.