-


Follow Us

Welcome to my annual player review series, where I dive into the Edmonton Oilers season player-by-player. We’ll look back at the season that was, what kind of impact each player had, and what we could see from them next season. You can read about the analytics behind my analysis here.
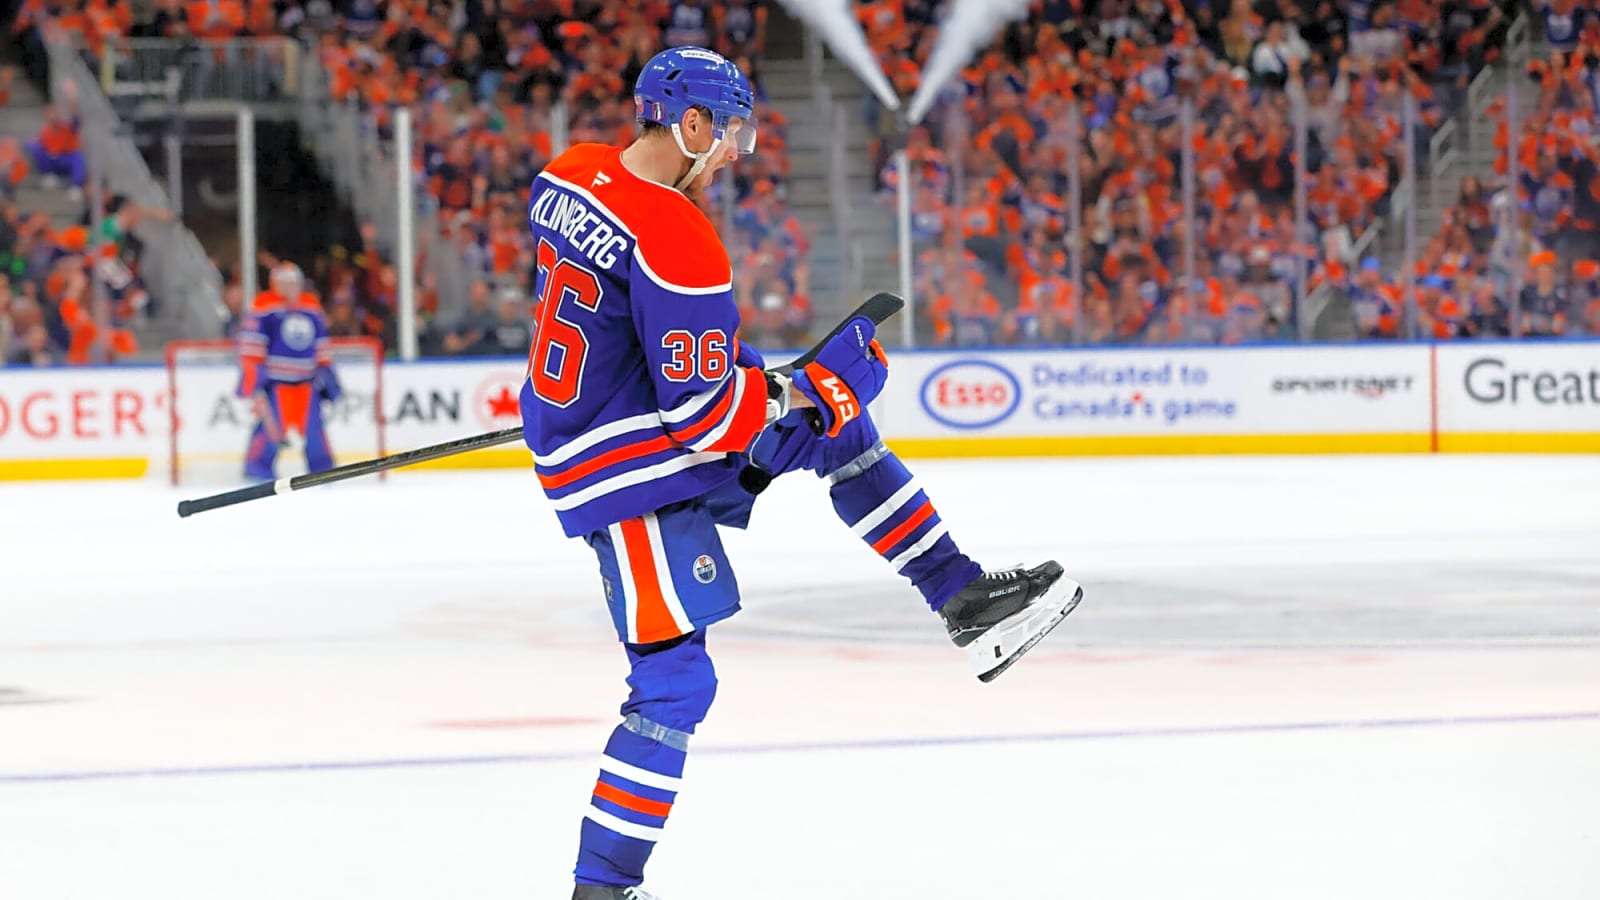
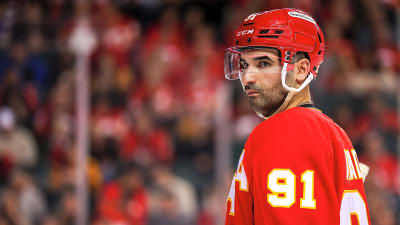
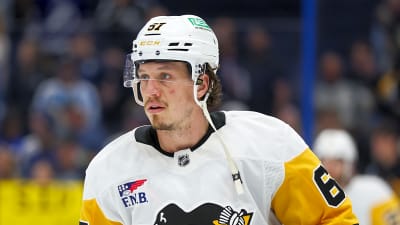
It’s safe to say that nobody expected the contributions John Klingberg made to the Oilers in the playoffs to be the case.
After all, he arrived in January signing a prorated one-year deal for the remainder of the season, a year removed from major hip surgery that left him feeling the best he had in his pro career. He got into the lineup for 10 games, but in that 1oth, a March 4th game against the Anaheim Ducks, he blocked a shot leaving him with an ankle injury that put him on the shelf for three weeks. And while he returned for another, he reaggravated things keeping him out until the playoffs.
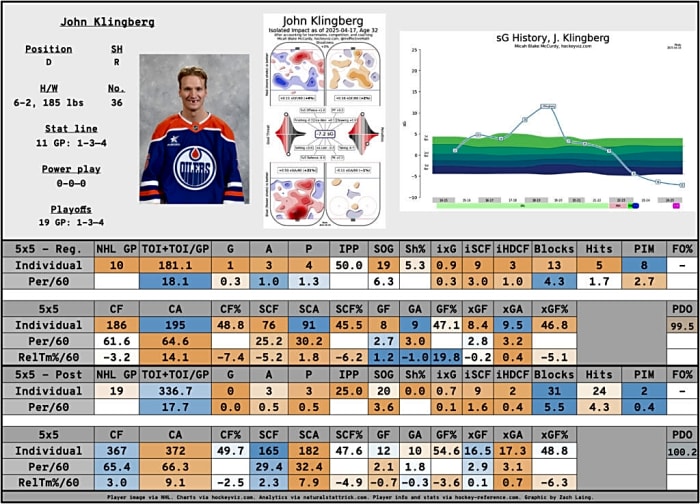
Those 11 regular season games, well, they didn’t go so great. Klingberg looked a step behind, and the underlying numbers showed that, with poor defensive metrics across the board and even worse impact numbers. While he drove offence at a four percent rate, his defensive impacts were at a 21 percent rate worse than league average, according to HockeyViz. He contributions overall were below replacement level.
When he was thrust into the lineup in Game 2 of the playoffs against the Los Angeles Kings, it didn’t take long for him to make an impact, notching an assist in that game. And partnered with Jake Walman, the duo were nothing short of incredible for the Oilers, giving the team some much needed depth.
Through the first three rounds, they dominated the expected goal and actual goal share at five-on-five, to the tune of 56.7 percent and 55.6 percent, but both numbers dipped in the Final against the Florida Panthers.
Still, Klingberg’s play — in the words of head coach Kris Knoblauch — was something that noticably helped the Oilers.
The Oilers opted to let him walk in free agency, the right move, as he signed a one-year, $4-million deal with the San Jose Sharks with trade protection that will allow him to find a new home ahead of next years trade deadline.
JOHN KLINGBERG’S CAREER SO FAR
| Season | Team | GP | G | A | PTS | +/- | PIM | PTS/G | PPG | SHG | GWG | SOG | S% | ATOI |
| 2014-2015 |
65 11 29 40 5 32 0.62 2 0 3 98 11.2 21:50 2015-2016
76 10 48 58 22 30 0.76 2 0 4 171 5.8 22:41 2016-2017
80 13 36 49 2 34 0.61 4 0 3 124 10.5 23:21 2017-2018
82 8 59 67 10 26 0.82 1 0 3 204 3.9 24:04 2018-2019
64 10 35 45 6 12 0.70 5 0 5 153 6.5 24:32 2019-2020
58 6 26 32 -10 22 0.55 2 0 0 120 5.0 22:10 2020-2021
53 7 29 36 -15 23 0.68 2 0 1 108 6.5 22:42 2021-2022
74 6 41 47 -28 34 0.64 1 0 2 139 4.3 22:13 2022-2023
50 8 16 24 -28 30 0.48 1 0 3 78 10.3 20:52 2022-2023
17 2 7 9 3 4 0.53 1 0 0 34 5.9 19:56 2023-2024
14 0 5 5 -7 8 0.36 0 0 0 14 0.0 20:33 2024-2025
11 1 3 4 0 8 0.36 0 0 0 19 5.3 17:15 Totals: 644 82 334 416 -40 263 0.65 21 0 24 1262 6.5 262:9
OTHER PLAYER REVIEWS
More must-reads:
- NHL's 2025-26 opening night slate is a showcase opportunity for the league
- Sabres, Bowen Byram avoid arbitration with new two-year deal
- The 'No. 1 overall MLB Draft picks' quiz
Breaking News
Trending News
Customize Your Newsletter
 +
+
Get the latest news and rumors, customized to your favorite sports and teams. Emailed daily. Always free!

PRIVACY POLICY EDITORIAL POLICY CONTACT US
ABOUT YARDBARKER TERMS OF SERVICE
Use of this website (including any and all parts and
components) constitutes your acceptance of these
Terms of Service and Privacy Policy.
This site is for entertainment purposes only.
There is no gambling offered on this site.
Gambling Problem? Call 1-800-Gambler.