-

-


Follow Us
-


It’s rivalry weekend in Pasadena as the #12 USC Trojans travel to face off against the #1 UCLA Bruins in a clash of Big Ten heavyweights.
The Trojans, led by spectacular pitching on the backs of Mason Edwards and Grant Govel, will look to make a statement.
While the unbeaten Bruins and consensus #1 overall draft selection Roch Cholowsky will look to defend home turf in what is certain to feel like a postseason matchup.
All stats updated prior to games on Wednesday, April 1
USC Trojans Big Ten Preview
Pitching
USC is astoundingly dominating hitters this season. It is, of course, the elite starters in Edwards and Govel that have teams baffled, and rightfully so. However, that should not take away from the contributions of a guy like Andrew Johnson, who has thrown together a 2.86 ERA as the Trojans’ third starter.
Long-inning relievers like Sax Matson and Gavin Lauridsen have done a stellar job on clean-up duty, though not frequently needed. The team’s closer, Adam Troy, has been lights out, accumulating nine saves in as many opportunities.
bullpen boys locked it down #FightOn x @GavinLauridsen x @saxmatson pic.twitter.com/cblkGnyAcj
— USC Baseball (@USC_Baseball) March 29, 2026
Among Power 4 programs, the Trojans find themselves inside the top 10 in exit velocity against, barrel percentage allowed, BABIP, BAA, ERA, FIP, and WHIP. They do not overpower hitters with velocity and spin, but rather with finesse and by generating weak contact.
Edwards and Govel both achieve almost 6 inches on extension with average spin rates over 2300 RPM. Both pitchers also generate north of 21 inches of induced vertical break on their fastballs and get plenty of swing and miss on their off-speed pitches.
Hitting
USC’s hitting profile doesn’t jump off the page when you look at it. They are second-worst in average exit velocity among P4 programs, 50th in barrel rate, and 55th in percentage of balls hit 95+ mph. Among predictive metrics indicative of strong offensive teams, the Trojans do not perform particularly well.
However, the Trojans take pride in their ability to be stingy at the plate. They are 48th in chase rate, but 4th in foul balls, and 6th in contact rate. On pitches inside the zone (and beyond), USC hitters do an average to elite job at putting balls in play. The Trojans love to bunt, bunting in almost 3% of balls put in play, a top 20 rate in P4.
The Trojans are the 6th-best P4 team in miss rate, despite chasing out of the zone at a high clip, as mentioned previously. They do their best work attacking heaters, and struggle against soft stuff and break, displaying a .216/.305/.349 slash line against soft stuff and breaking balls.
The Trojans are not known for winning games via their offensive prowess, but have extremely capable hitters scattered throughout their lineup.
Adrian Lopez, Kevin Takeuchi, and Abbrie Covarrubias are all valuable assets at the top of the Trojan lineup. The lineup is not one known for damage, the theme of their profile. The Trojans are 42nd in home runs hit and 45th in SLG% among P4 teams.
The story of this series will be situational hitting and being sound defensively. That is what has worked for the Trojans all season, and they’ll try to stick to it.

Defense
Defensively, nobody is more efficient than the Trojans, converting 73.9% of balls in play into outs, first out of all P4 programs. They also possess a 97.8% infield fielding percentage with a middle infield of Abbrie Covarrubias and Maddox Riske, who have combined for just one error all season. In the outfield, the Trojans have an almost spotless 99.5% fielding percentage. The defensive effort of USC has complemented their already incredible pitching to make them one of college baseball’s most feared matchups.
UCLA Bruins Big Ten Preview
Pitching
The Bruins’ staff is fronted by Logan Reddemann and Michael Barnett. Reddemann, a USD transfer, hasn’t skipped a beat in adjusting to Big Ten competition, amassing almost a 35% strikeout rate and walking under 4% of hitters on a 2.72 ERA. He is a true Swiss Army Knife with a 6-pitch mix. If that wasn’t enough to worry a hitter, his twitchy setup can make him tough to time up.
Barnett is a senior who has truly elevated his game to a new level for the Bruins this season. His changeup is his signature pitch and serves as his put-away pitch, sitting down 40% of hitters. Opponents are also OPS’ing .492 against his fastball. He has been prone to the long ball, allowing 6 on the season. Barnett’s .220 BAA, which has a 71-point differential from his .291 xBAA, could be a signal of regression. That trend continues for many of his expected rates and figures.
They are anchored by one of (if not the) the most dominant closers in college baseball, Wylan Moss. Moss has put together a dazzling 0.35 ERA. He can get up to 7 inches of extension off the bump, which helps his 94-mph fastball play a tick up.
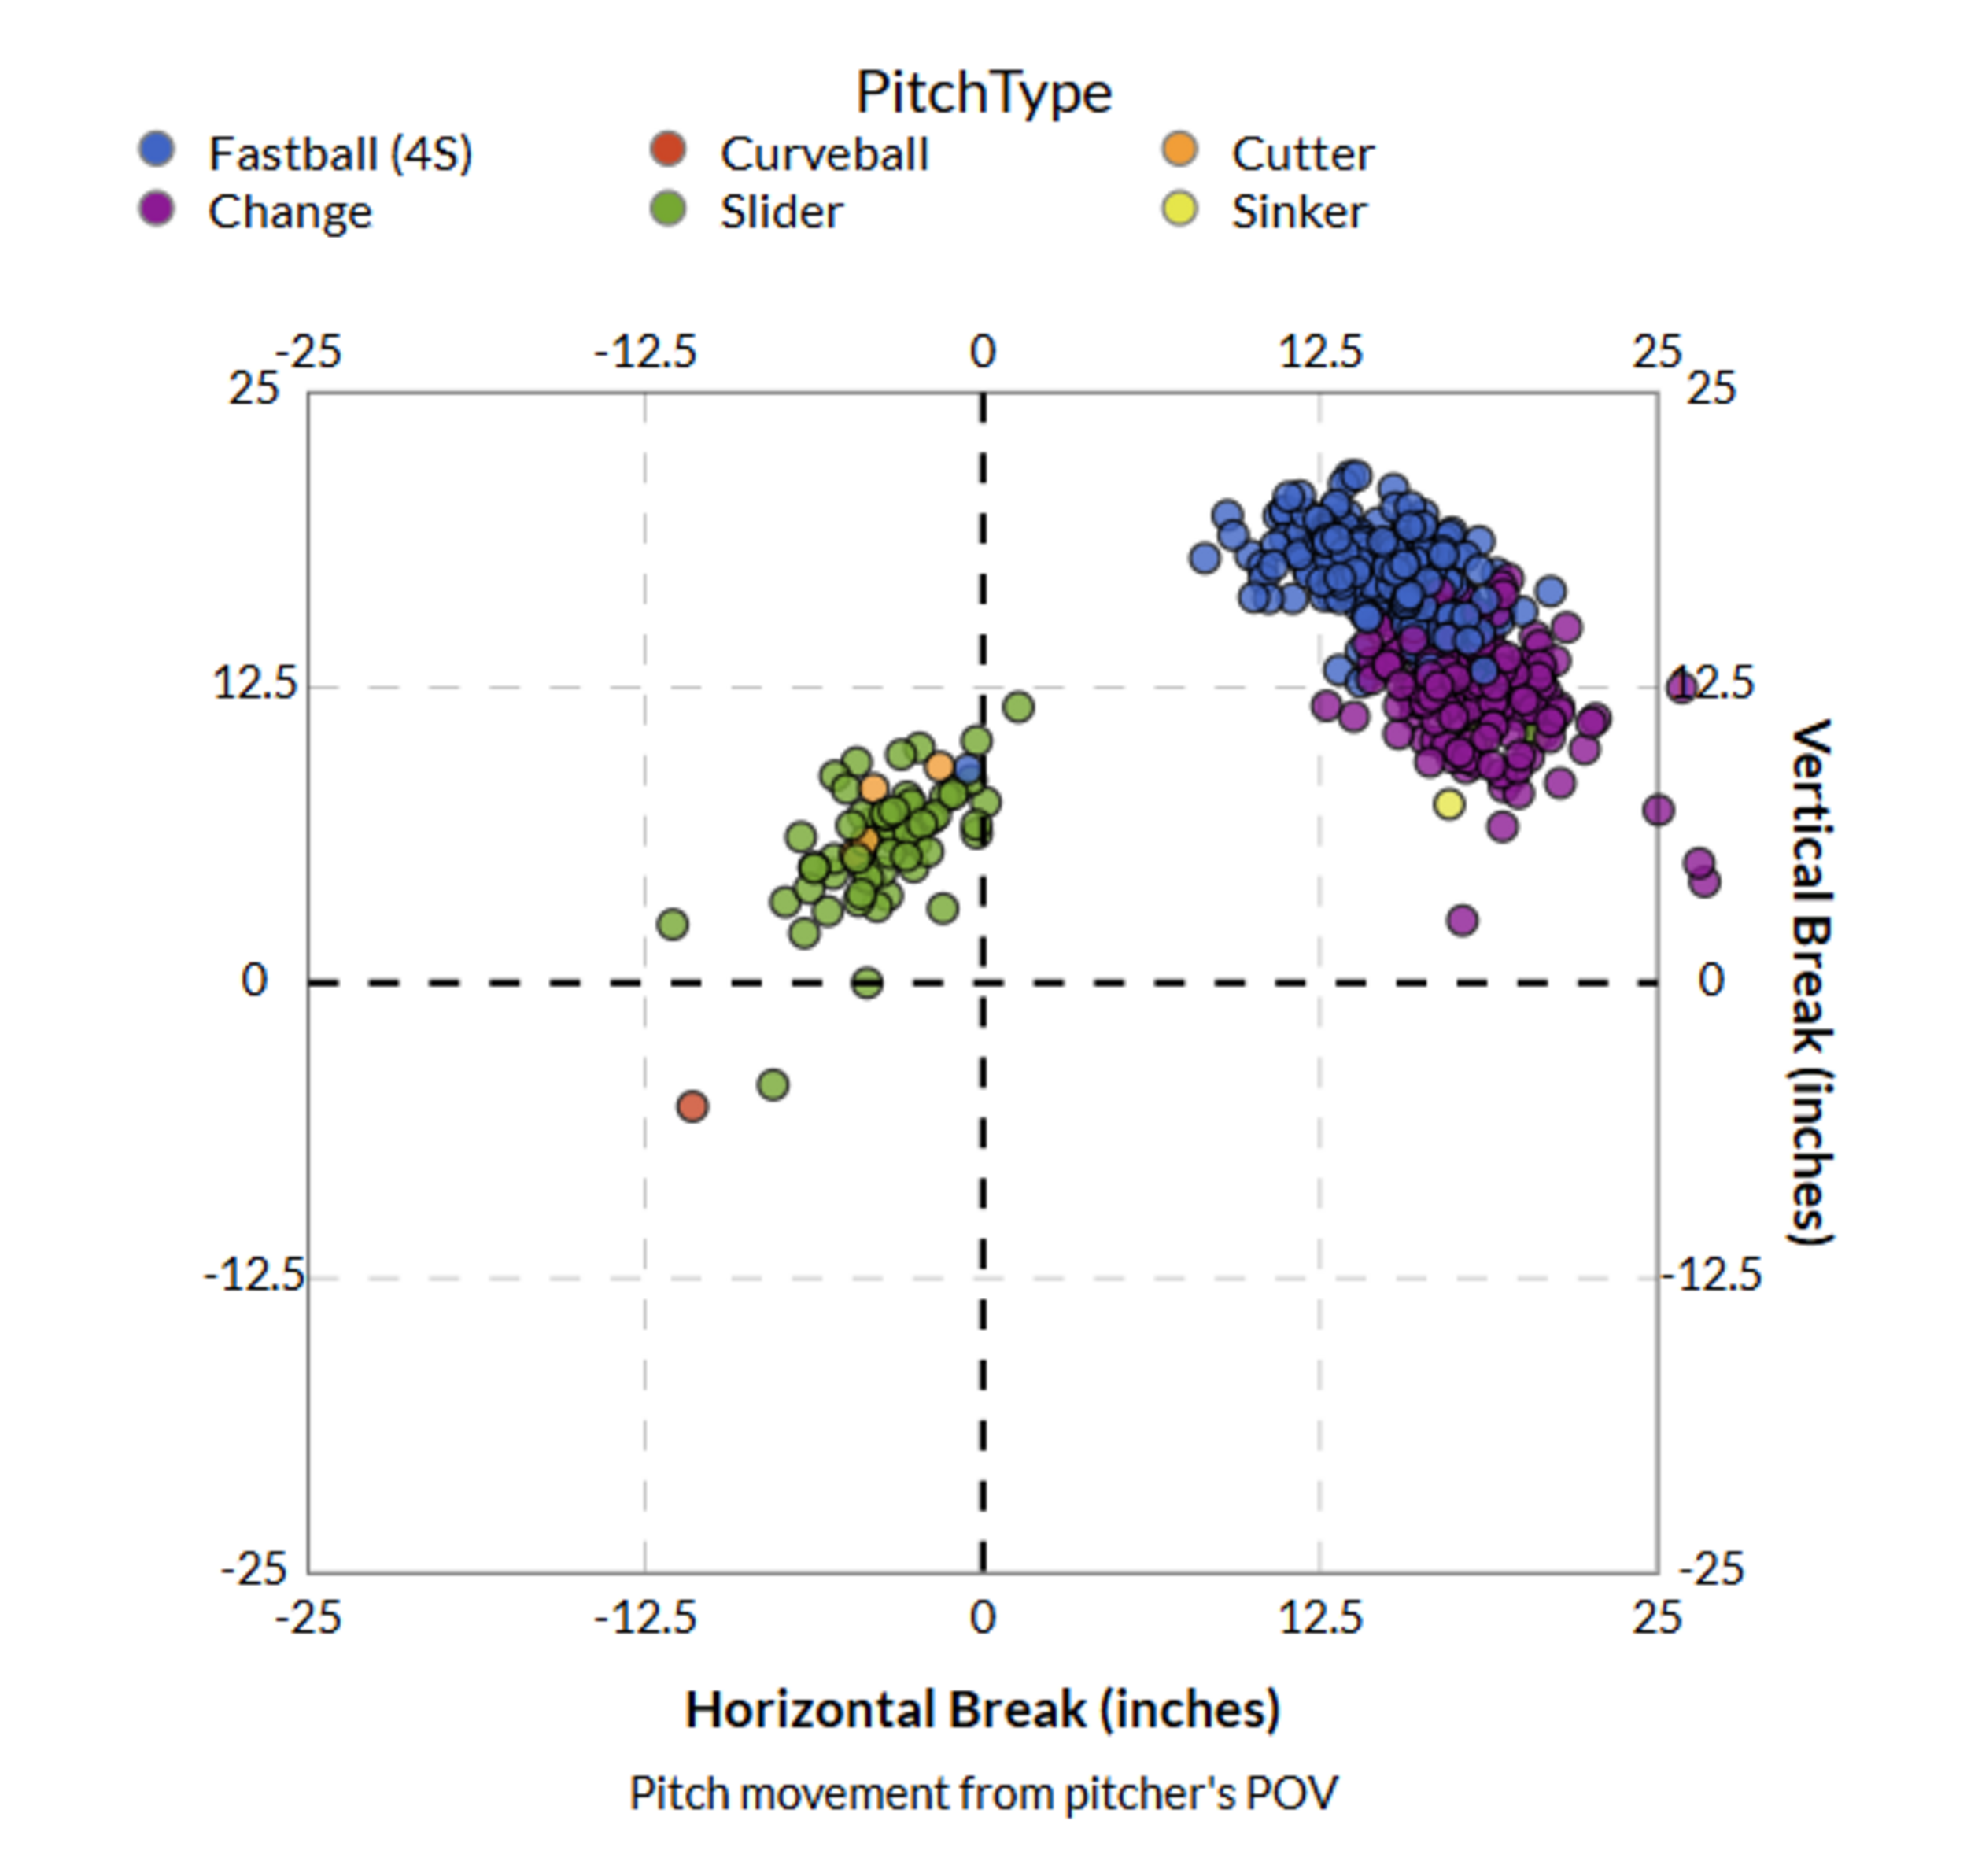
As seen in the pitch chart above, Moss is mainly a fastball, changeup, and slider guy. His fastball and changeup start in a relatively similar position, creating a great tunneling effect to make his secondary pitches more effective throughout his sequencing. To be this effective with a three-pitch mix is a testament to his execution on the mound and pitch shapes.
Hitting
At the plate, the numbers speak for themselves. Outside of college baseball’s best player in Roch Cholowsky, the Bruins have an elite supporting cast of sluggers. Mulivai Levu, Will Gasparino, and Roman Martin have been some of the best hitters in all of collegiate baseball.
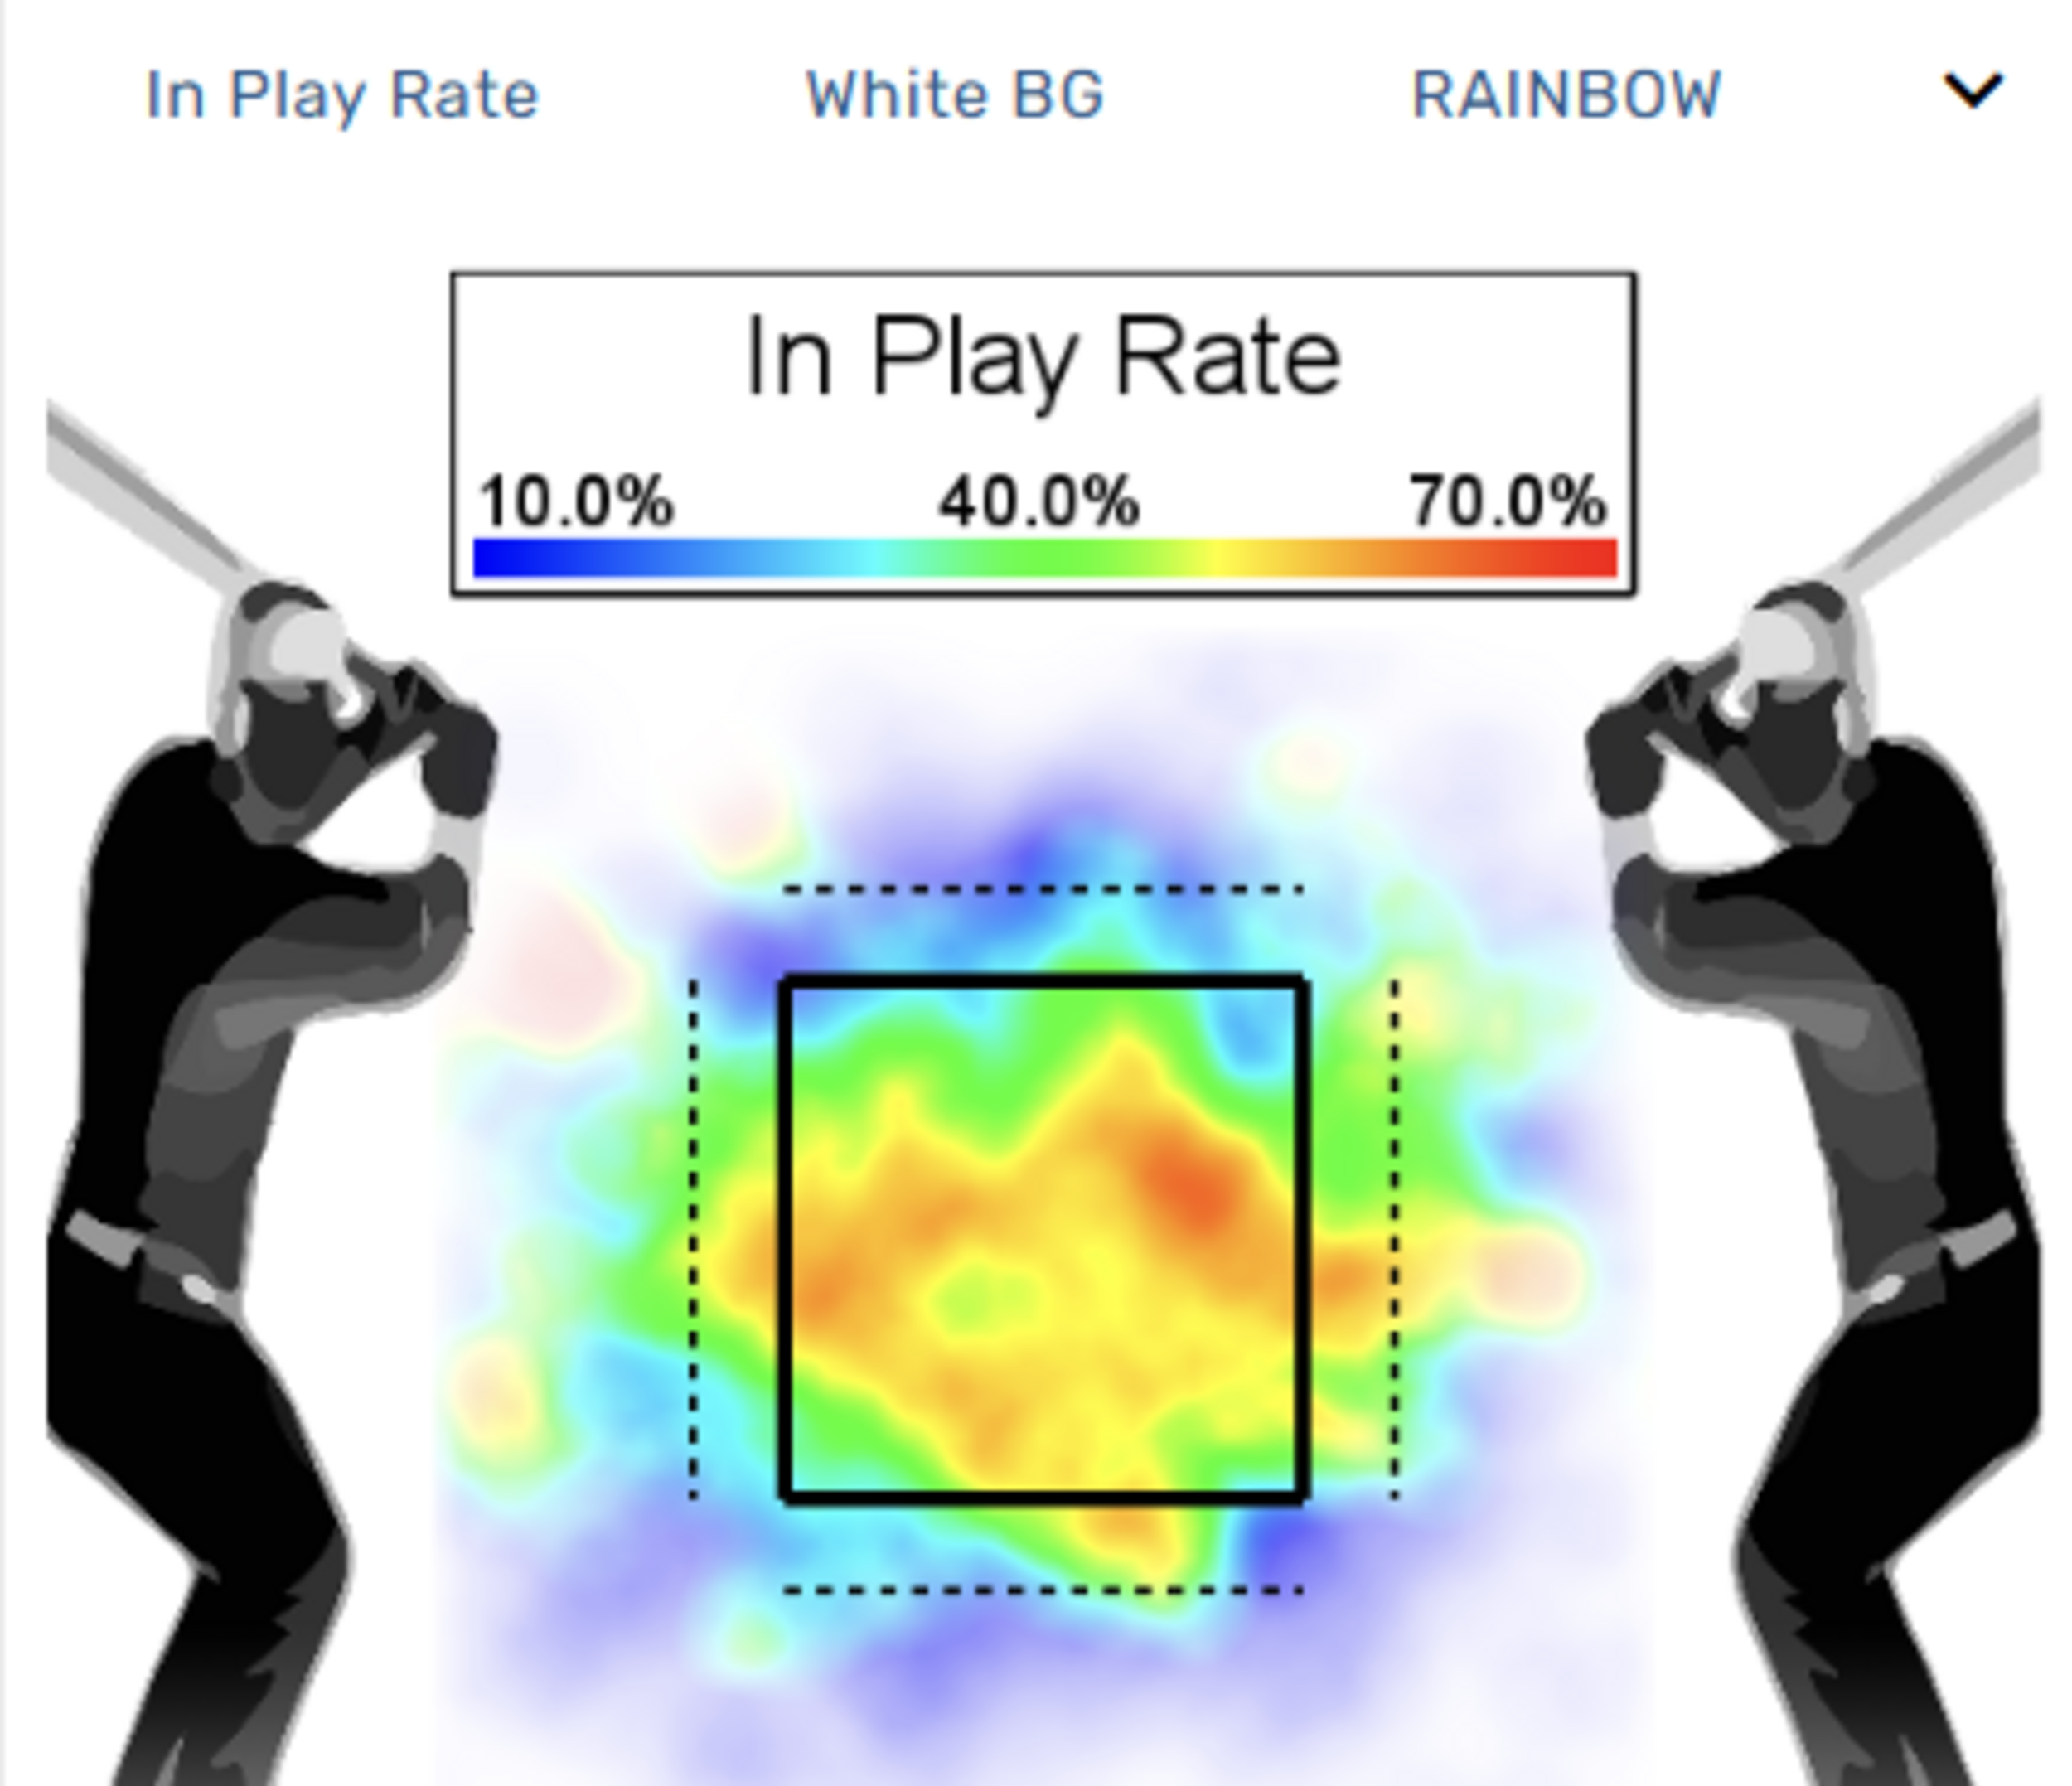
From a team profile, the Bruins excel at doing damage up in the zone, with a team SLG% of .830 on pitches in the upper middle part of the zone. Like most teams, UCLA does damage against fastballs, but they perform even better against opposing pitchers’ soft stuff like changeups and splitters. They also do a great job at putting the ball in play when they get a pitch to hit, illustrated in the heatmap below.
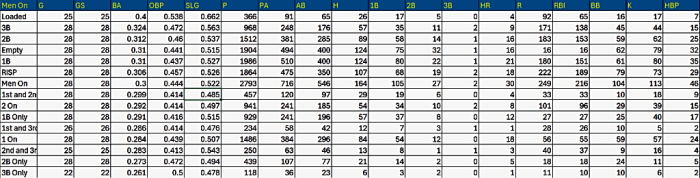
The Bruins are great situational hitters, doing their best work with the bases loaded, and posting a slash line of .306/.457/.526 with RISP. These veteran hitters rise to the occasion time after time. In the Bruins’ lineup, all nine players are at least 20 years old, with seven being 21 or 22.
This is a group of hitters that have seen what this league has to offer for years. Their experience serves as a driving force in their ability to execute at the right moments. These veteran hitters also show their experience in their approach, hitting the ball to the opposite field at a rate just 8 percentage points less than their pull side rate.
Similar to the Trojans, the Bruins don’t perform well in the predictive metrics department but make up for it in bat-to-ball skills, plate discipline, and situational hitting. They strike out the seventh-least number of times amongst P4 schools while also having the seventh-best K/BB ratio. It is a relentless offense that has no breaks in the lineup.
Defense
Defensively, the Bruins stack up well against their P4 comrades, with an eighth-best defensive efficiency rating of 69.1%. In addition, the left side of their infield, with Roman Martin and Roch Cholowsky, is dynamic, not just at the plate but in the field as well. In the outfield, the Bruins possess a blemish free 100% fielding rate in 149 attempts. The Bruins are just one of seven P4 teams that haven’t committed an error in the outfield this season.
Matchup Analysis
I’ll be looking at two trends that I think could be the difference in this series. In a series with teams as well-coached as these, winning will be done along the margins. Edwards versus Cholowsky. Govel versus Levu. Meticulous pitching versus a military disciplined offense. Something has to give.
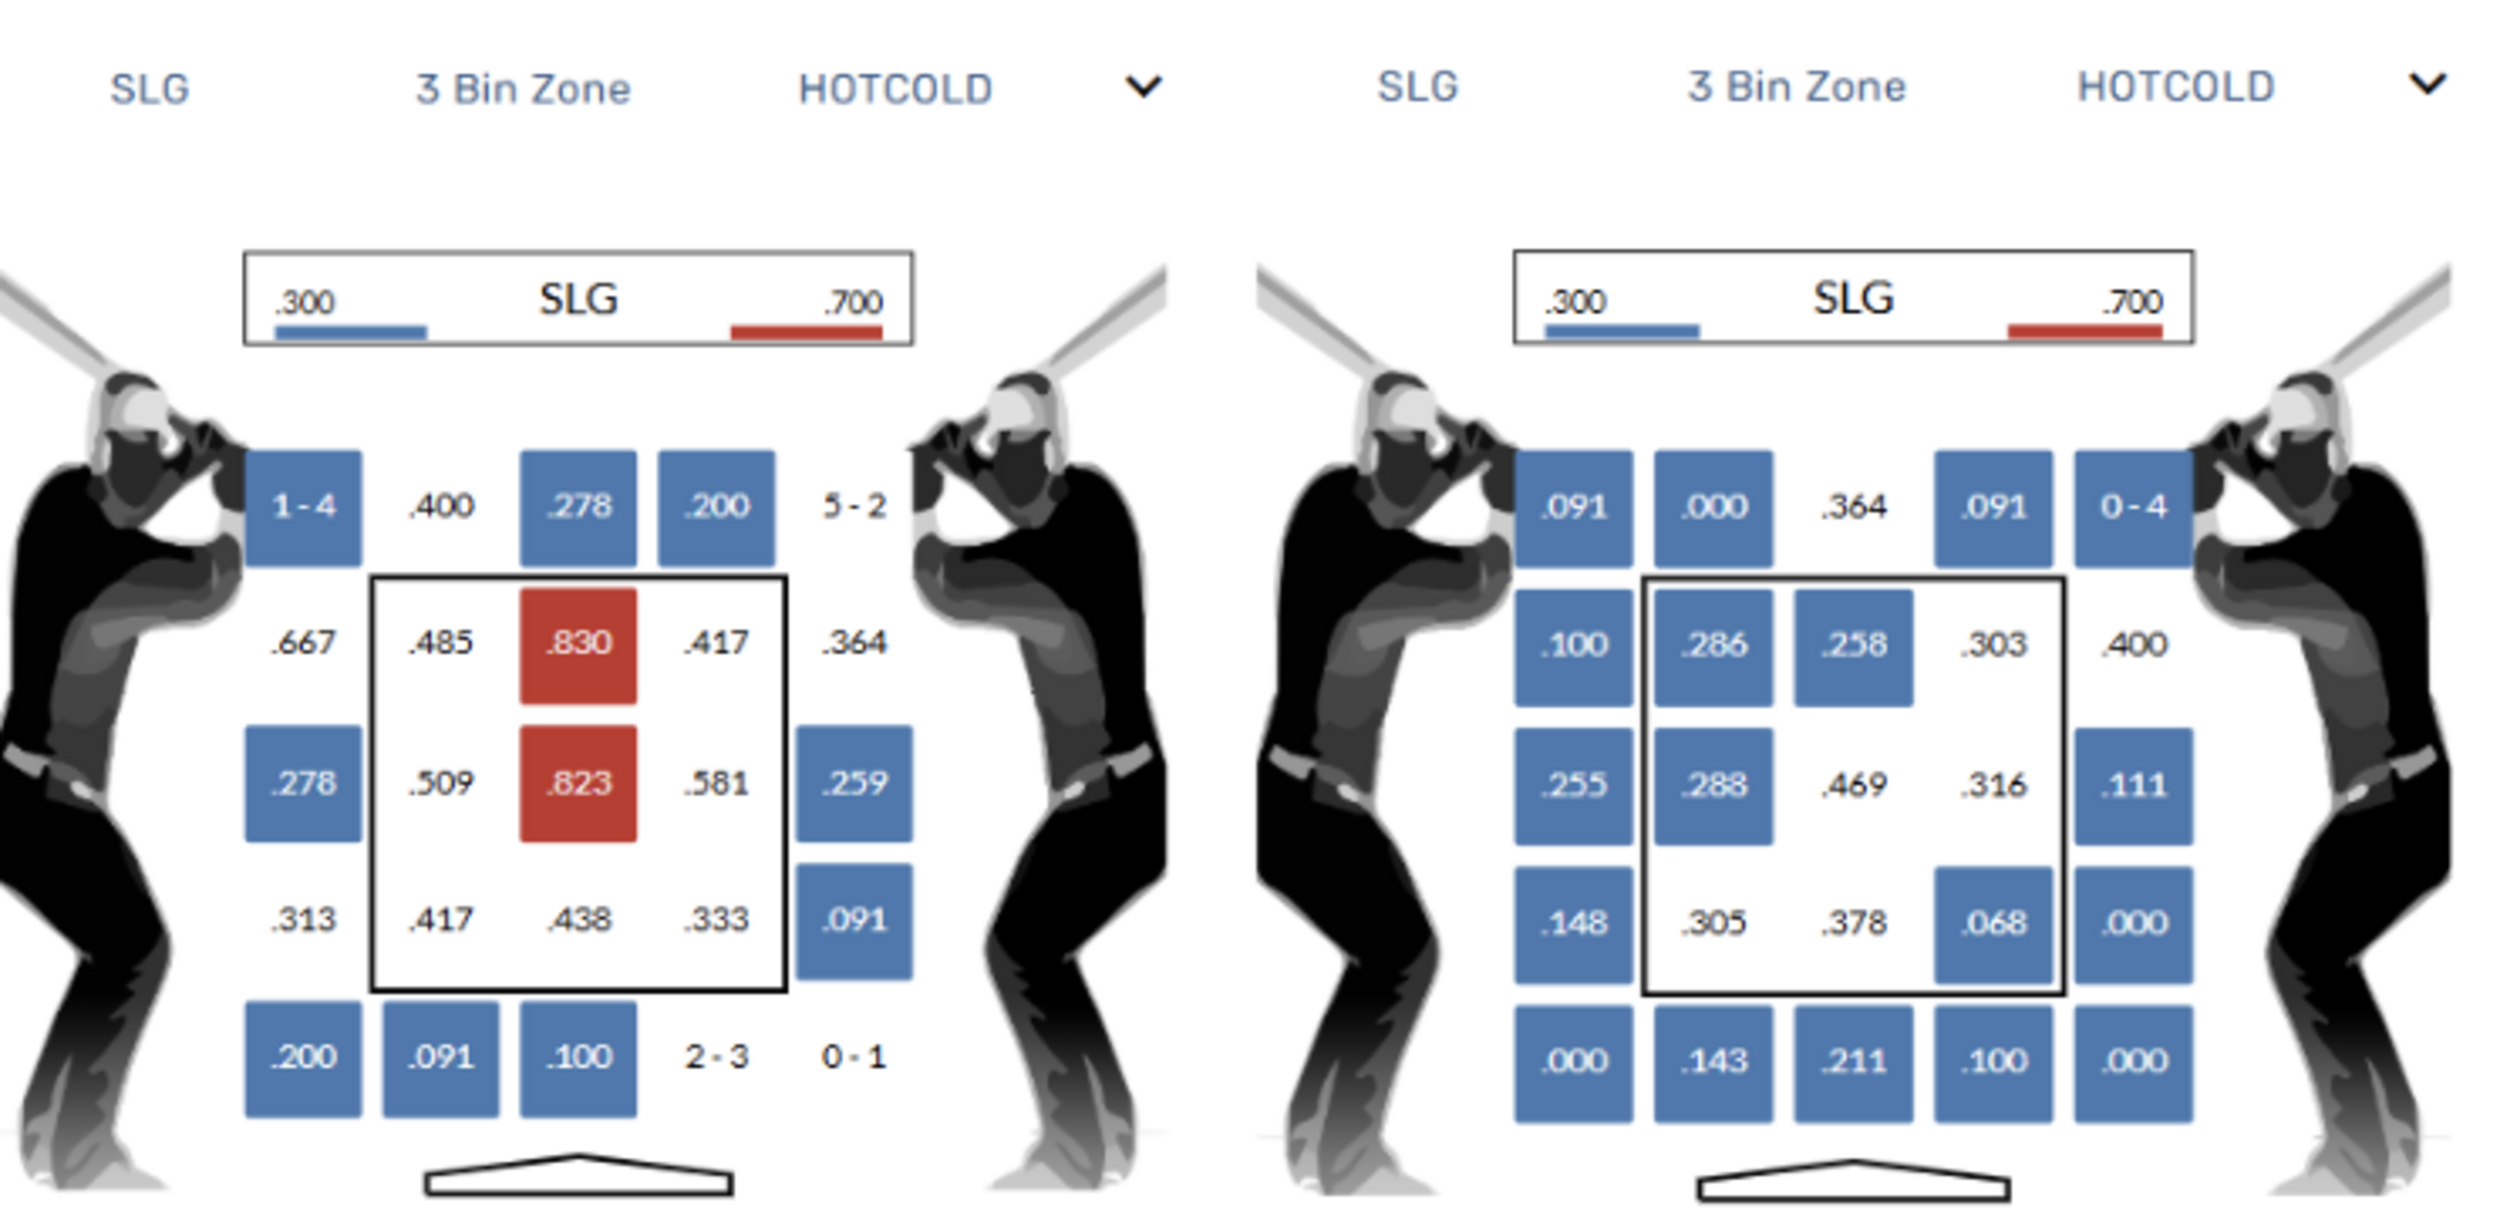
SLG vs. SLG Against
As mentioned earlier, UCLA doesn’t miss their pitch when they get it. They slug .400 or above in eight of nine quadrants and above .800 in two. Unfortunately for the Bruins, USC’s pitching staff has dominated pitches inside the zone all season, somehow generating a .469 SLG against pitches middle-middle. Given, the Trojans haven’t exactly faced Murderer’s Row thus far in the season, having faced not a single top 100 offense in runs per game, their efficiency can’t be denied.
Chase Rate Overlap
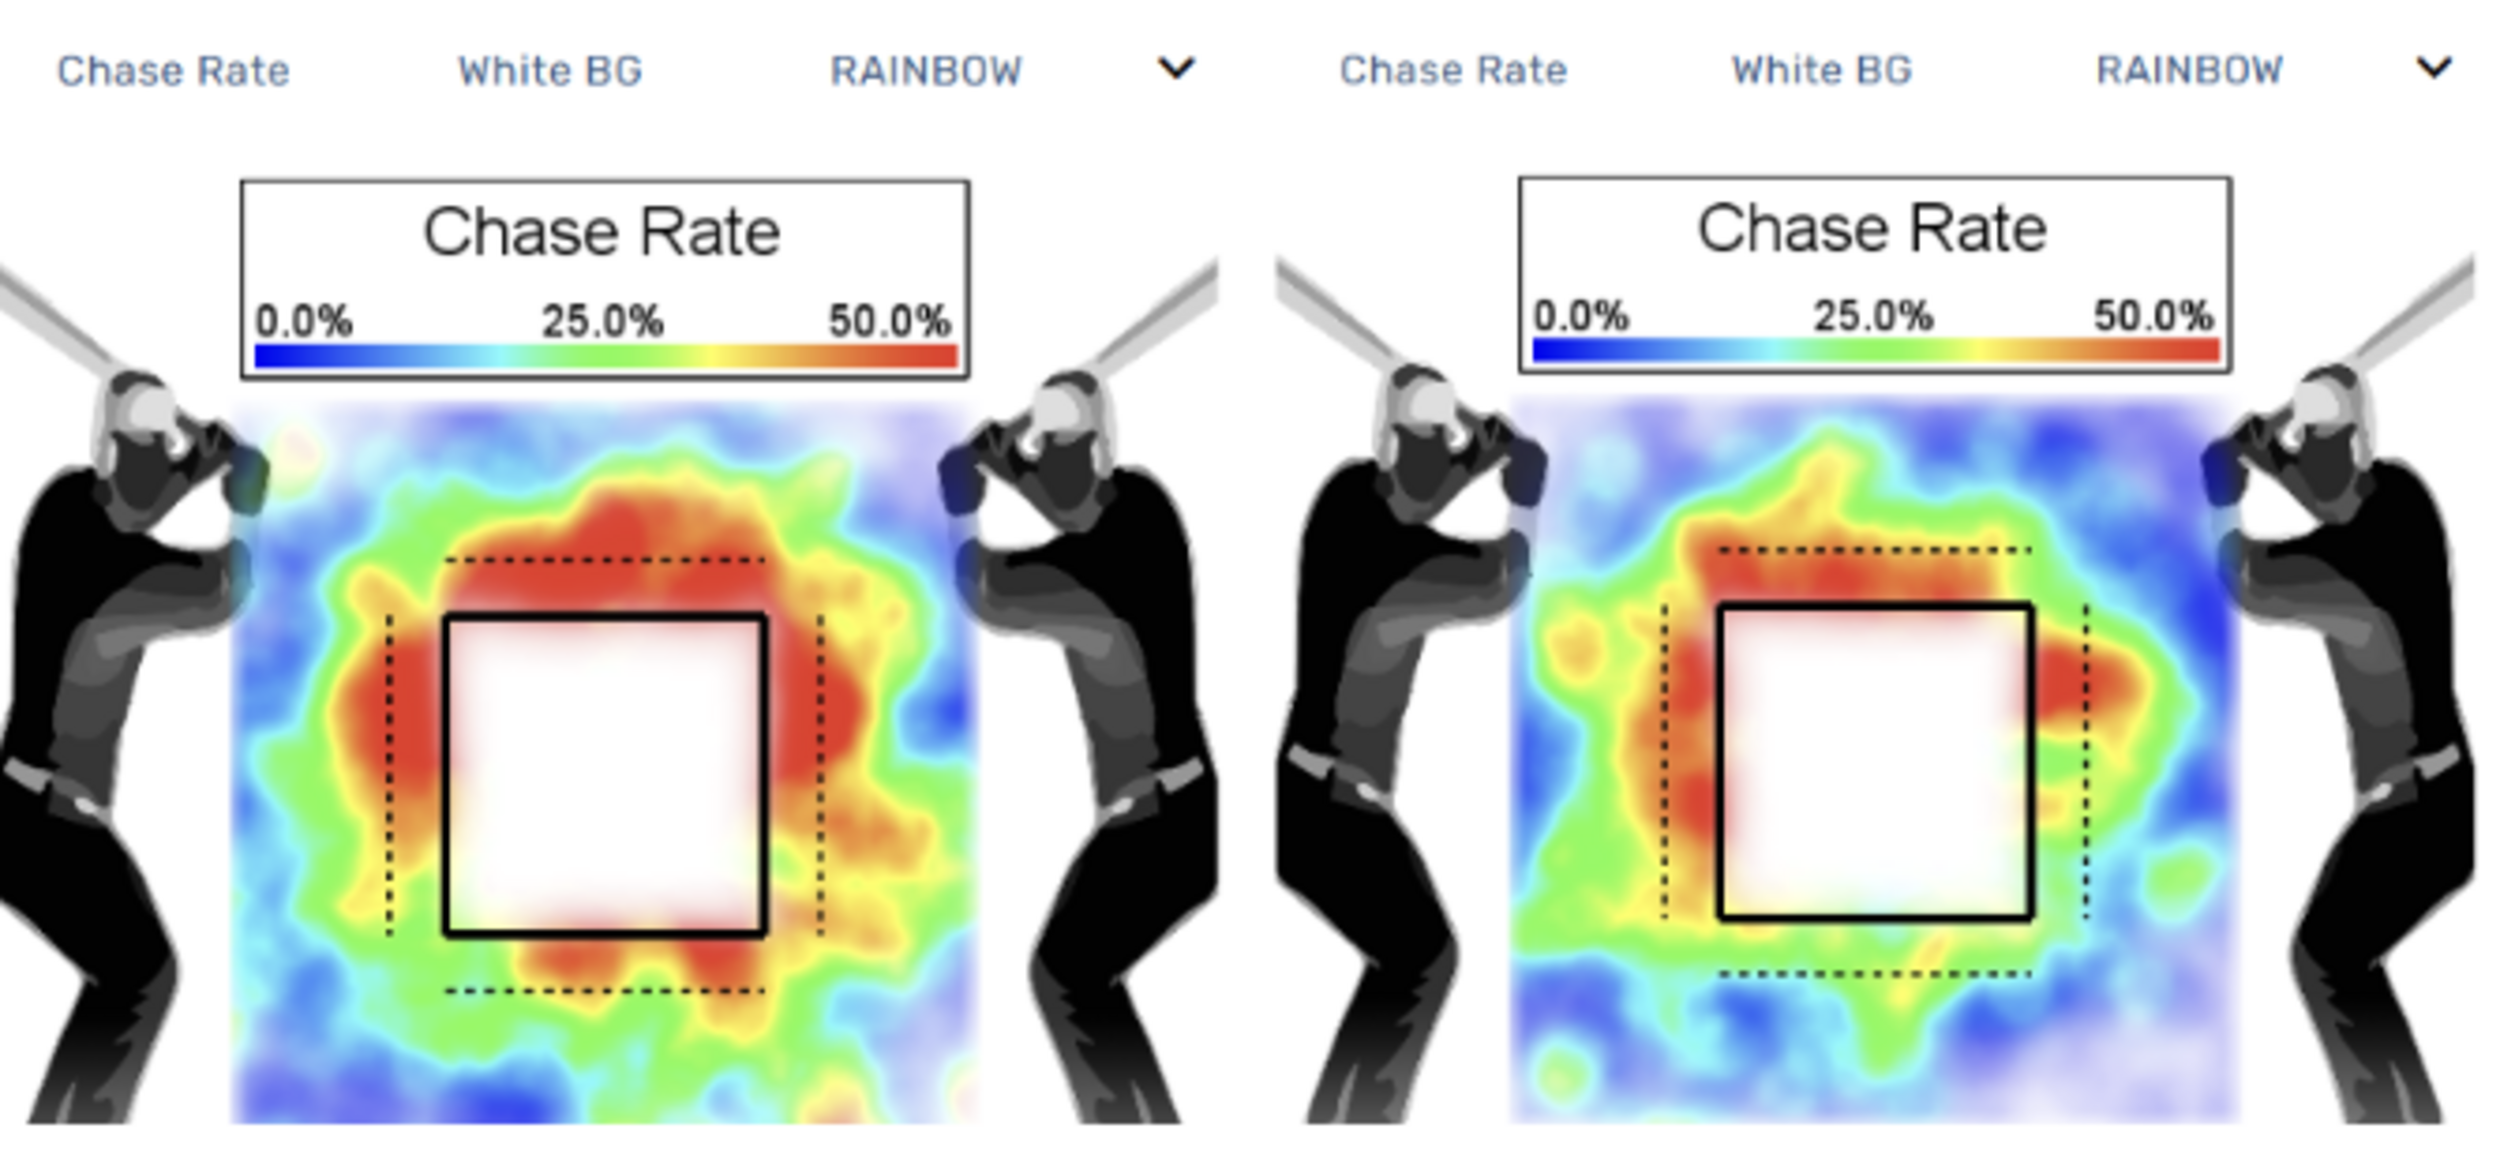
The Bruins do not hit for power when they escape the corners of the strike zone, like most teams. The Bruins are an extremely disciplined team at the plate, with a chase rate of just under 20%, good for the 11th best among P4 teams.
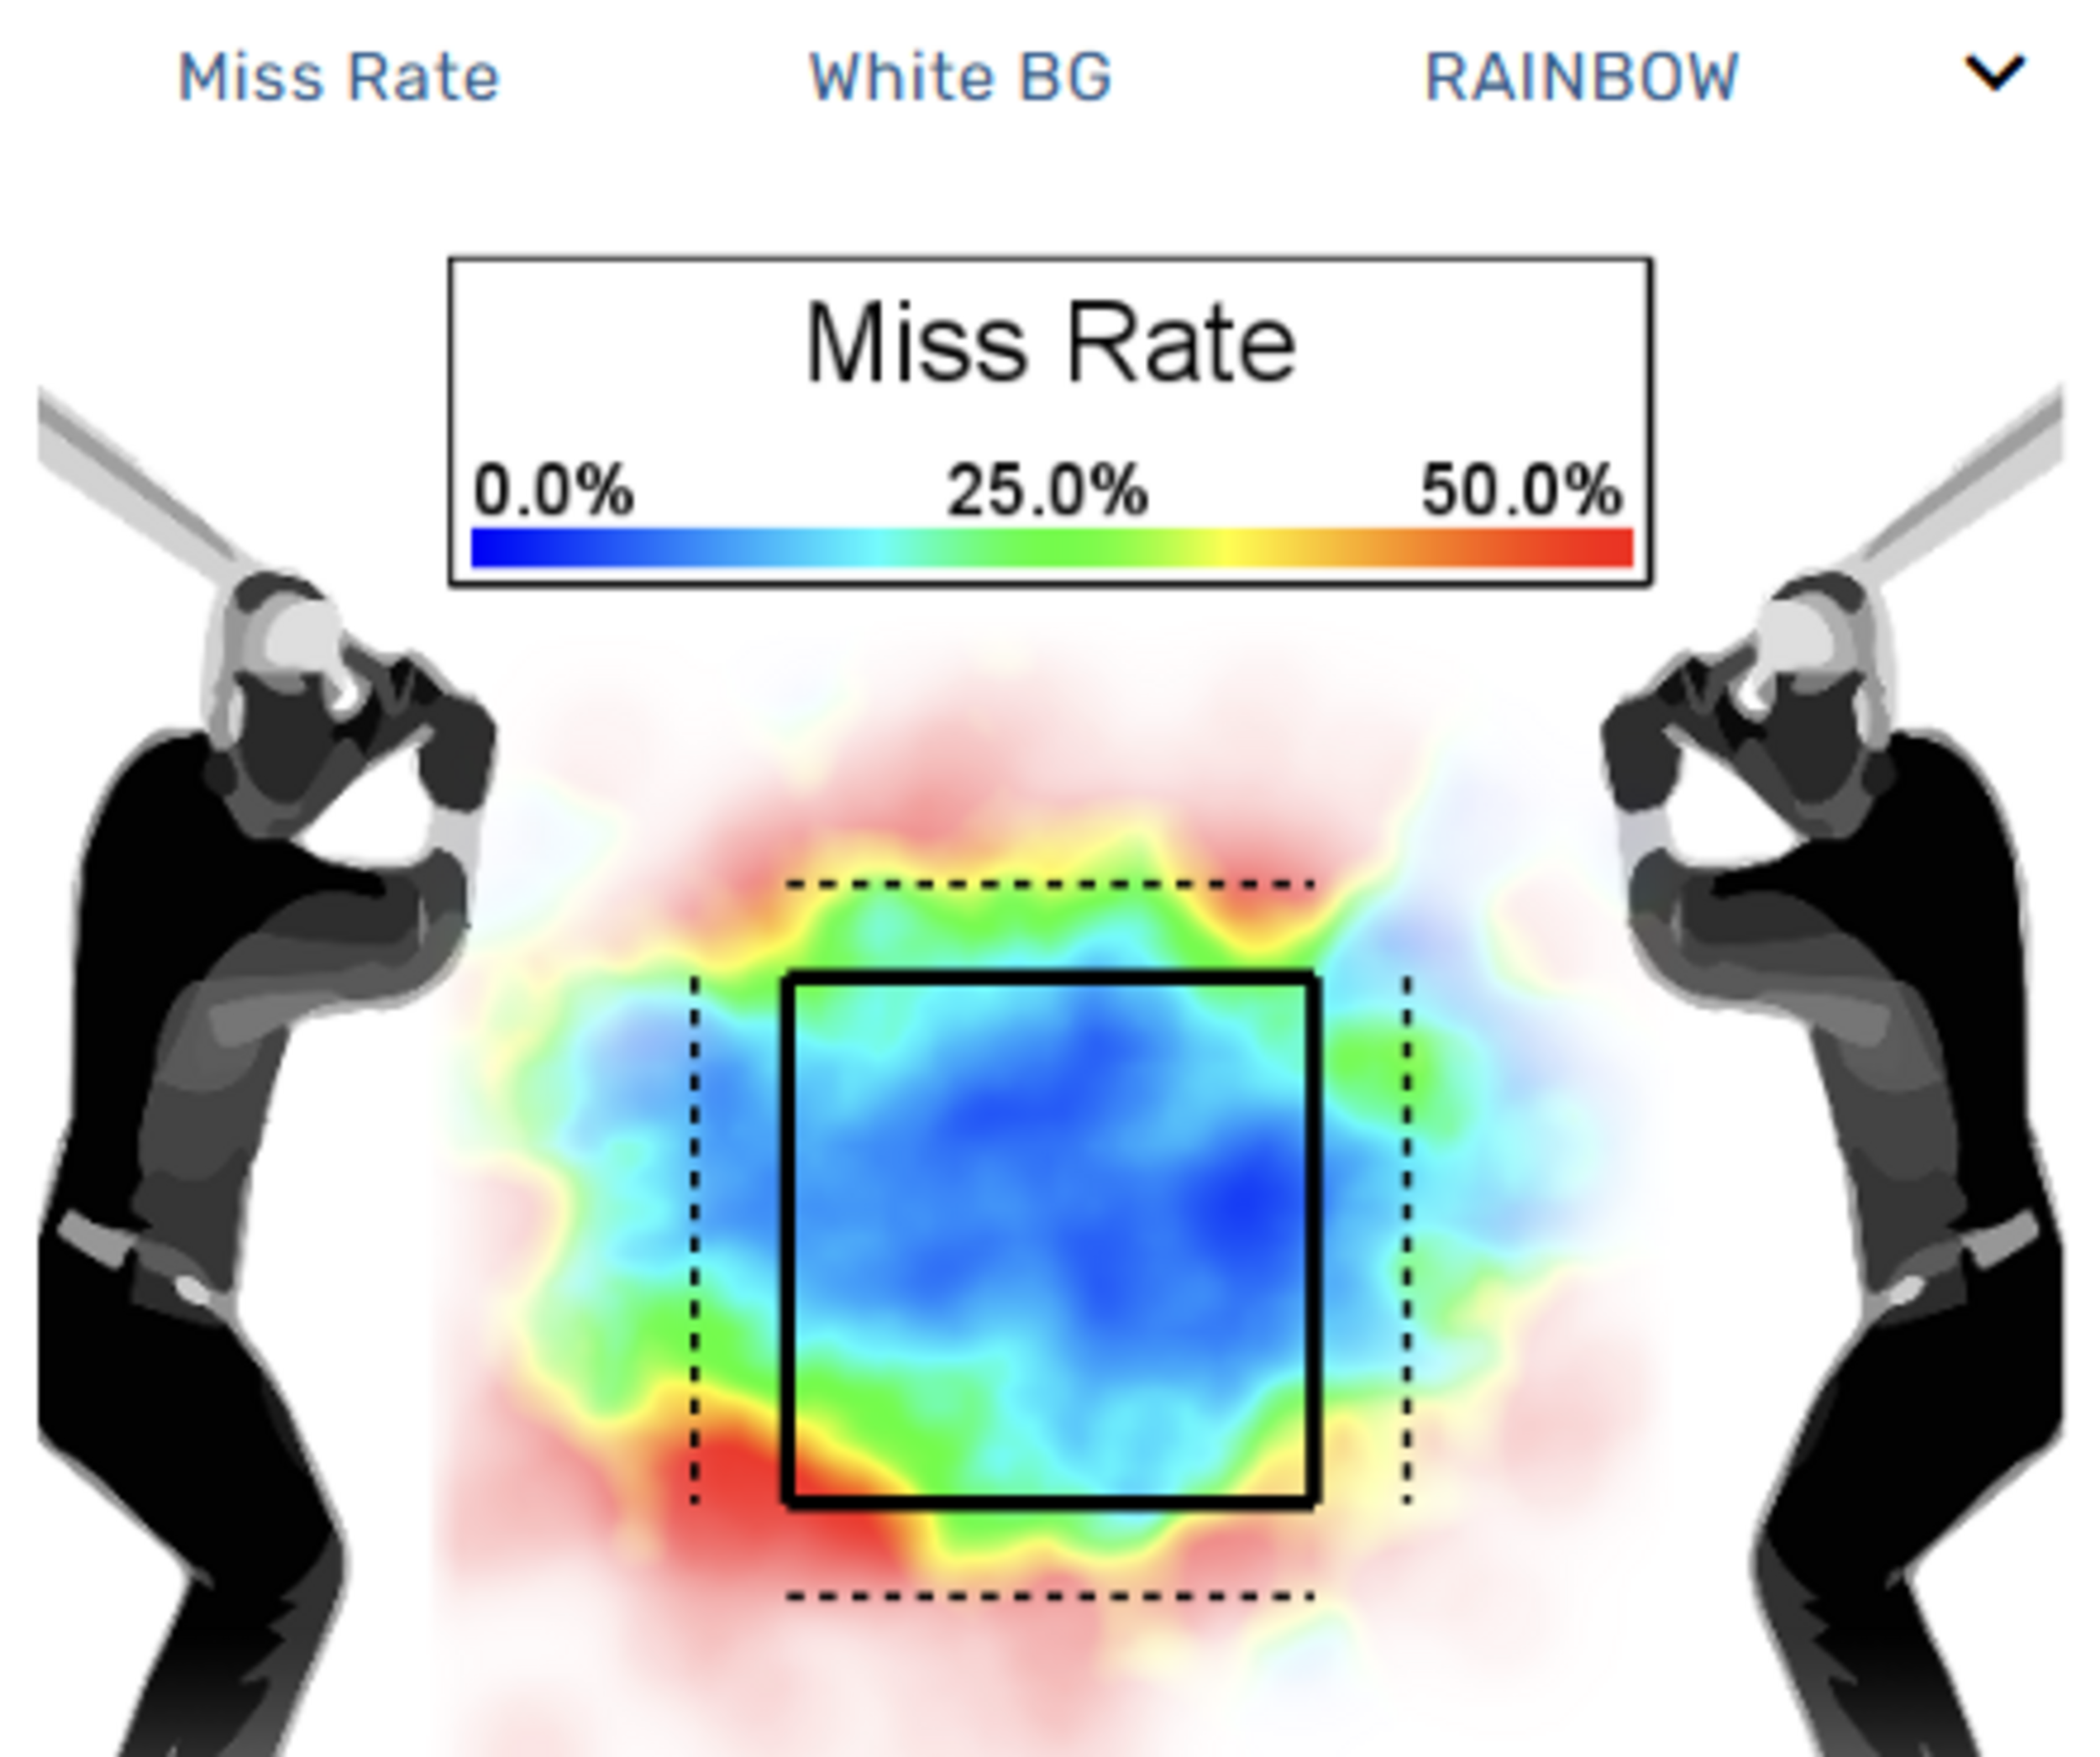
They are susceptible, however, to pitches at the top of the zone, which happens to be where USC generates the most whiffs. UCLA has chase rates pushing 50% in the top half of the zone on the east and west sides of the plate, as seen below. If Edwards, Govel, and the remainder of the USC staff are on, it could be a long day for Bruin hitters.
Closing Thoughts
The Trojans are a pitch-to-contact team. They do so by generating weak contact but still leave themselves susceptible to teams with great bat-to-ball skills and plate discipline, such as the Bruins.
The Bruins are overperforming in a variety of pitching predictive metrics and will be tested by a fierce offense that gets better the longer they stay in counts.
I think in a three-game series, the matchups against Edwards and Govel, combined with the ability for USC to exploit the finite vulnerabilities of UCLA’s lineup, will be too much for the Bruins to overcome.
More must-reads:
- New details emerge about Tiger Woods' arrest
- Hidden keys to victory for men's Final Four
- The 'NBA yearly free throw leaders' quiz
Breaking News
Trending News


Customize Your Newsletter
 +
+
Get the latest news and rumors, customized to your favorite sports and teams. Emailed daily. Always free!

PRIVACY POLICY COOKIE POLICY CONTACT US
ABOUT YARDBARKER TERMS OF SERVICE
By using this site, you agree to our Terms of Service and Privacy Policy.
This site is for entertainment purposes only.
There is no gambling offered on this site.
Gambling Problem? Call 1-800-Gambler.